For operators
Know your noise floor.
Log S-meter readings across 16 amateur bands, save measurement profiles for your equipment, and watch trends over weeks and months. When something changes, you will see it.
See how your noise floor changes over time.
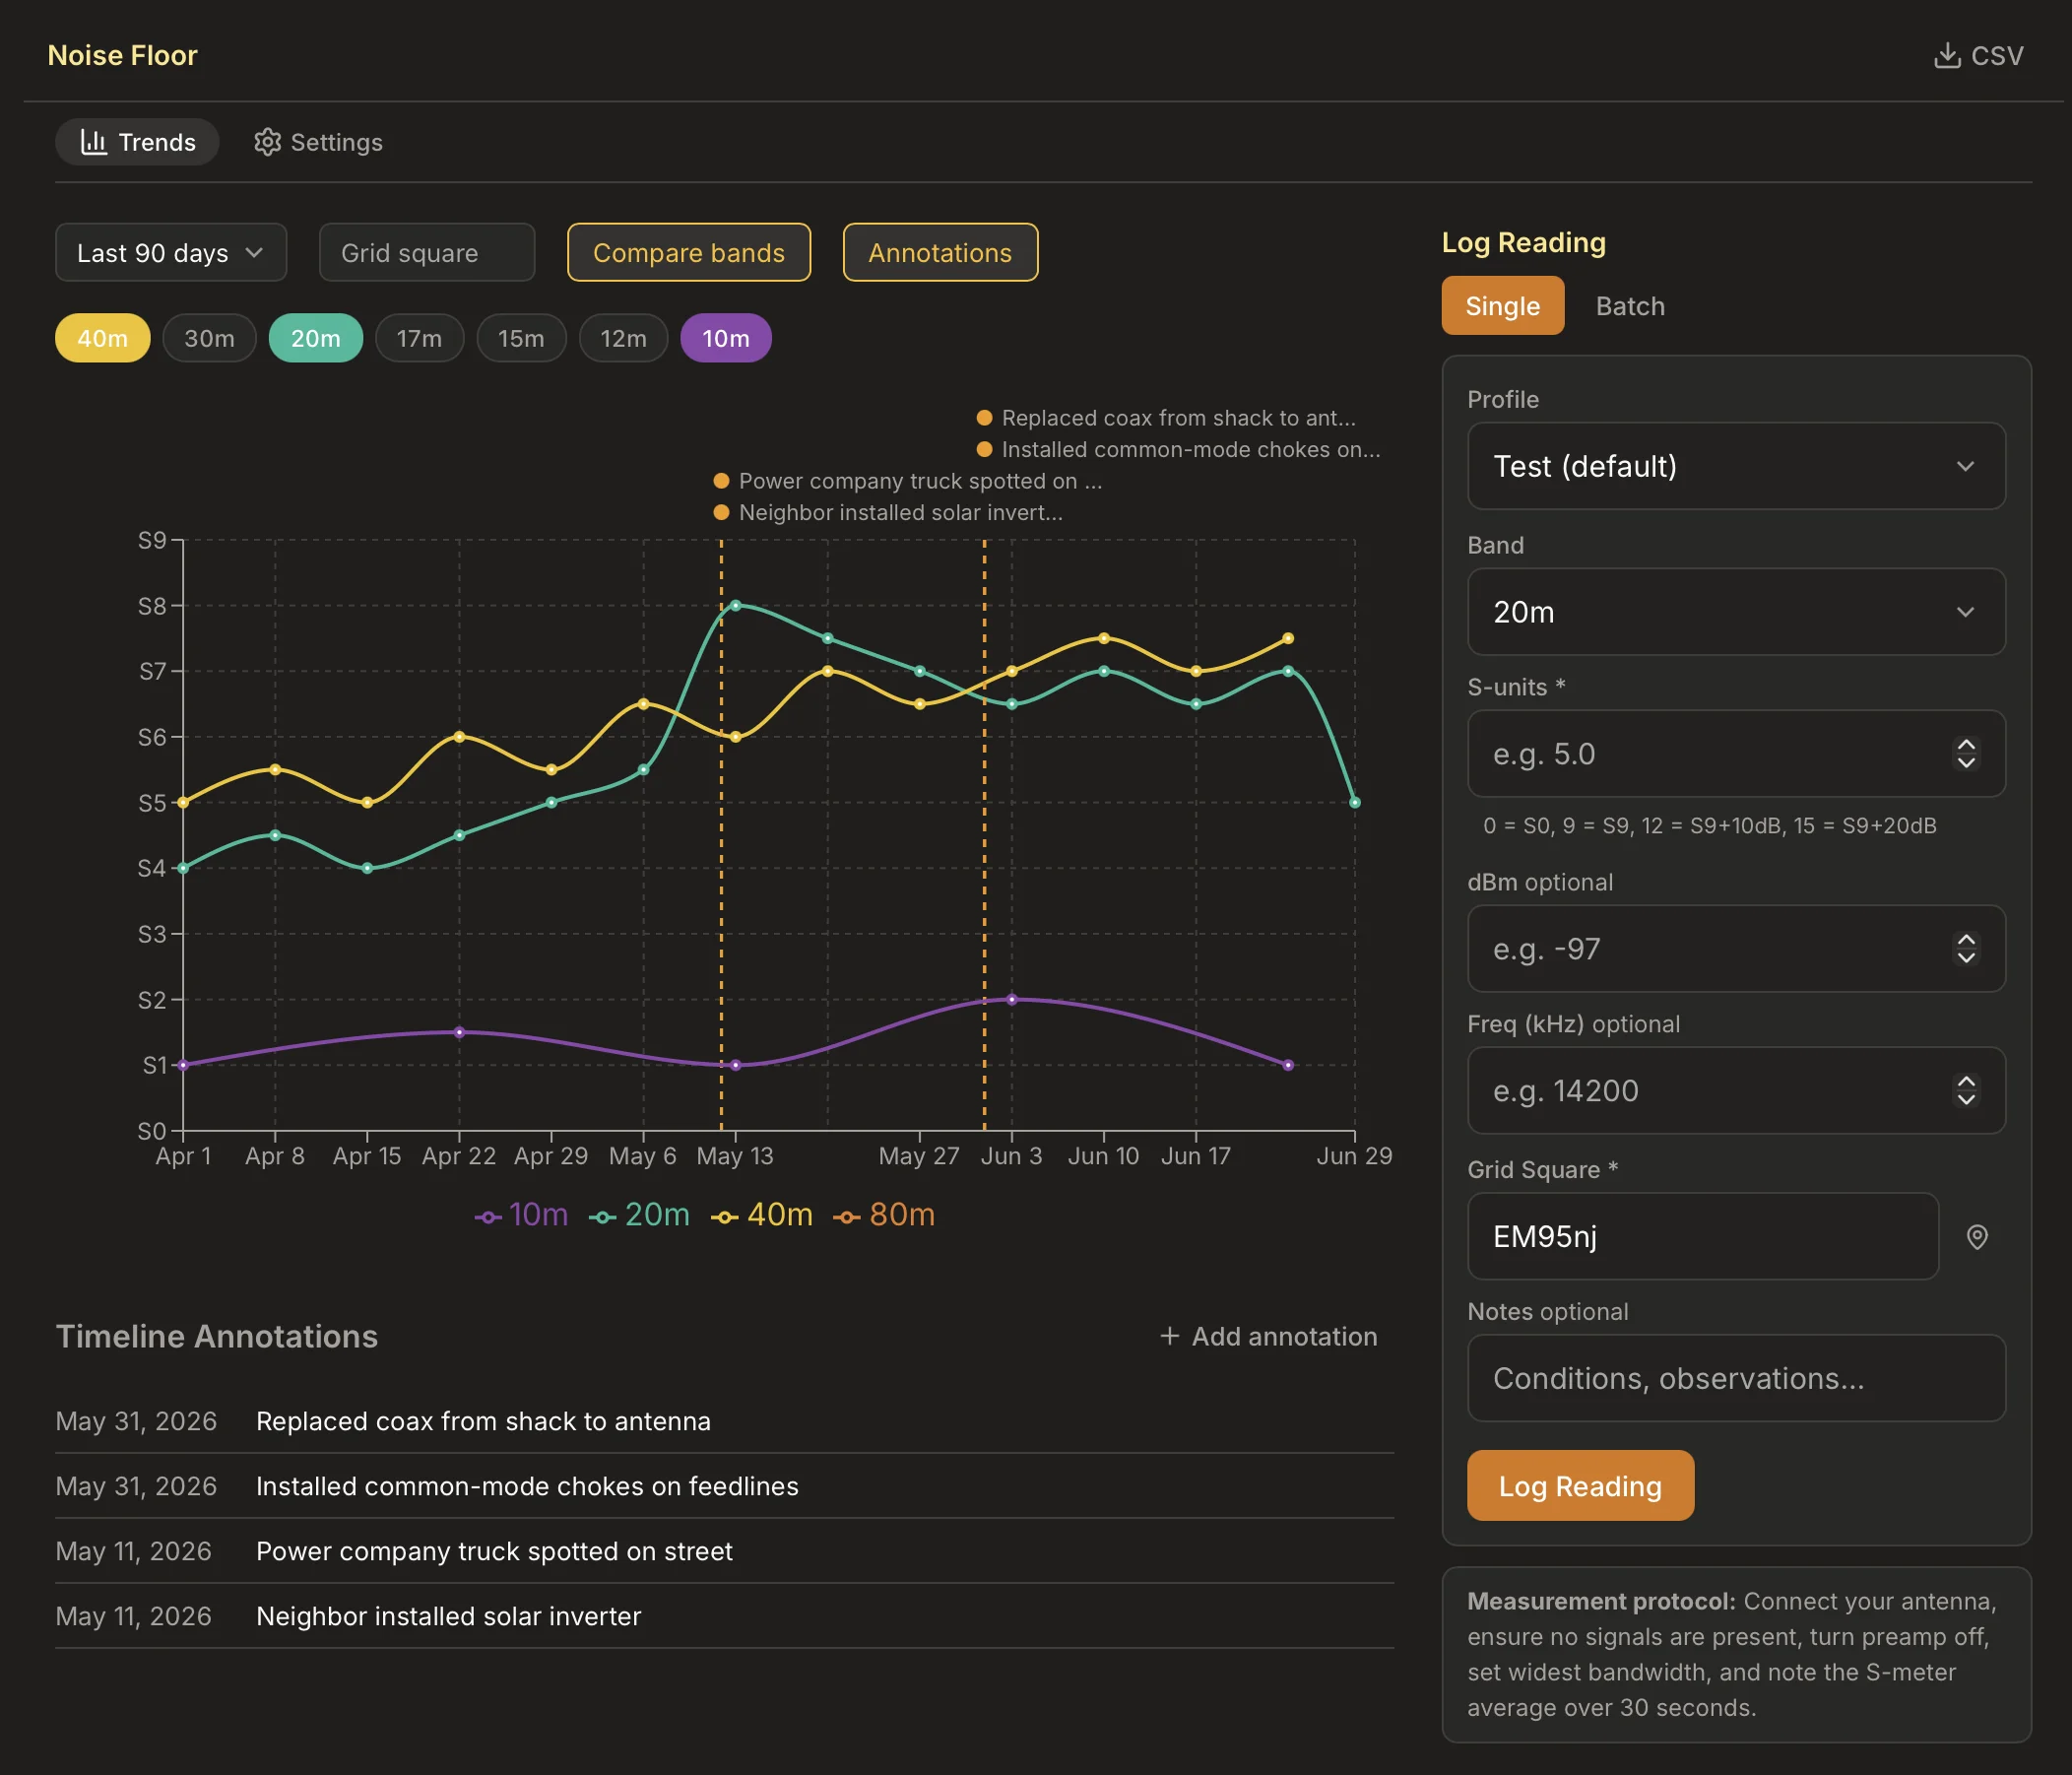
Interactive charts plot your S-meter readings per band. Overlay multiple bands on the same chart, filter by date range, and spot interference patterns as they develop. Add timeline annotations to mark equipment changes or new RFI sources, then correlate them with your readings.
- S-unit readings plotted per band with color coding
- Overlay multiple bands on one chart to compare
- Filter by 30 days, 90 days, one year, or all time
- Annotate equipment changes and RFI events right on the chart
Log readings your way.
Whether you are doing a quick check on one band or a full sweep of the spectrum, Groundwave captures the data and keeps it organized.
Measurement Profiles
Save your receiver, antenna, bandwidth, and preamp settings as named profiles. Pick a profile when you log a reading so every comparison is apples to apples.
Batch Entry
Measure all 16 bands from 160m to 23cm in one session. Tag each session with your Maidenhead grid square for portable RFI surveys and location comparisons.
CSV Export
Export your readings as a spreadsheet with one click. Filter by band, date range, or grid square. Take your data into a spreadsheet or signal analysis tool.
Free for every ham.
Noise floor tracking is available to individual operators at no cost. Claim your callsign and start logging readings.
Find Your Callsign